NASA's Virtual 'Summer Science Camp' Continues With Today's Chat About Comets

NASA Chat: Crumbling Comets Create Marvelous Meteors

Summer means fireworks, and here's how to see some of Nature's best displays. Start with a few comets streaking around the solar system, leaving behind dusty trails of gas, ice, rocks and dust. Then find a comfortable nighttime seat on planet Earth as it passes through these dusty comet trails. Finally, sit back and enjoy the show as bits of leftover comet burn up in our atmosphere, creating the celestial displays that we call meteor showers.

On Thursday, July 22, astronomer Bill Cooke from NASA's Marshall Space Flight Center will answer your questions about comets and meteors: their origins and cycles, their composition and colors and the best way to catch a glimpse of them in the night skies.

Bill has perfect timing: around July 28 and 29, the Southern Delta Aquarids meteor shower will peak as remnants of the Marsden and Kracht Sunskirting comets glow in the summer sky.

Joining the chat is easy. Simply visit this page on Thursday, July 22 from 3-4 p.m. EDT. The chat window will open at the bottom of this page starting at 2:30 p.m. EDT. You can log in and be ready to ask questions at 3:00.

More About Chat Expert Bill Cooke

The head of NASA's Meteoroid Environment Office, Dr. Bill Cooke specializes in the meteoroid environment and its effects on space vehicles of all sorts. While a graduate student at the University of Florida, he worked on instruments flying onboard balloons, the Space Shuttle, Giotto (European mission to Halley's Comet), and the Long Duration Exposure Facility.

After obtaining his PhD, he came to work at Marshall Space Flight Center as a member of the Space Environments Team. When not occupied with meteor observations and shower forecasts, he dabbles as a free- lance author for magazines and is a mentor for the Team America Rocketry Challenge and NASA's Student Launch Initiative rocketry programs.

NASA Moves Forward on Commercial Partnership for Rocket Engine Testing


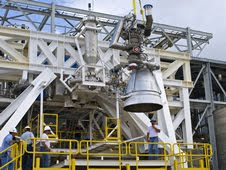
Engineers at NASA's John C. Stennis Space Center recently installed an Aerojet AJ26 rocket engine for qualification testing as part of a partnership that highlights the space agency's commitment to work with commercial companies to provide space transportation.

Stennis has partnered with Orbital Sciences Corporation to test the AJ26 engines that will power the first stage of the company's Taurus® II space launch vehicle. Orbital is working in partnership with NASA under the agency's Commercial Orbital Transportation Services (COTS) joint research and development project. The company is under contract with NASA through the Commercial Resupply Services program to provide eight cargo missions to the International Space Station through 2015.


The latest step in the project involved delivery and installation of an AJ26 engine for testing. In upcoming days, operators will perform a series of "chilldown" test, which involves running sub-cooled rocket propellants through the engine, just as will occur during an actual "hotfire" ignition test.

Stennis operators have been modifying their E-1 test facility since April 2009 to test the AJ26 engines for Orbital. Work has included construction of a 27-foot-deep flame deflector trench.


The chilldown tests are used to verify proper temperature conditioning of the engine systems and elapse time required to properly chill the engine, and to measure the quantity of liquid oxygen required to perform the operation.

Once the installed engine passes the chilldown and other qualification tests, it will be removed from the Stennis E-1 test facility. The first actual flight engine then will be delivered and installed for hotfire testing.

Hubble Shows Black Hole Booted Star From Milky Way

Hyperfast Star Was Booted From Milky Way
A hundred million years ago, a triple-star system was traveling through the bustling center of our Milky Way galaxy when it made a life-changing misstep. The trio wandered too close to the galaxy's giant black hole, which captured one of the stars and hurled the other two out of the Milky Way. Adding to the stellar game of musical chairs, the two outbound stars merged to form a super- hot, blue star.

This story may seem like science fiction, but astronomers using NASA's Hubble Space Telescope say it is the most likely scenario for a so-called hypervelocity star, known as HE 0437-5439, one of the fastest ever detected. It is blazing across space at a speed of 1.6 million miles (2.5 million kilometers) an hour, three times faster than our Sun's orbital velocity in the Milky Way. Hubble observations confirm that the stellar speedster hails from the Milky Way's core, settling some confusion over where it originally called home.

Most of the roughly 16 known hypervelocity stars, all discovered since 2005, are thought to be exiles from the heart of our galaxy. But this Hubble result is the first direct observation linking a high-flying star to a galactic center origin.

The stellar outcast is already cruising in the Milky Way's distant outskirts, high above the galaxy's disk, about 200,000 light-years from the center. By comparison, the diameter of the Milky Way's disk is approximately 100,000 light- years. Using Hubble to measure the runaway star's direction of motion and determine the Milky Way's core as its starting point, Brown and Gnedin's team calculated how fast the star had to have been ejected to reach its current location.

The most likely explanation for the star's blue color and extreme speed is that it was part of a triple-star system that was involved in a gravitational billiard-ball game with the galaxy's monster black hole. This concept for imparting an escape velocity on stars was first proposed in 1988. The theory predicted that the Milky Way's black hole should eject a star about once every 100,000 years.

Brown suggests that the triple-star system contained a pair of closely orbiting stars and a third outer member also gravitationally tied to the group. The black hole pulled the outer star away from the tight binary system. The doomed star's momentum was transferred to the stellar twosome, boosting the duo to escape velocity from the galaxy. As the pair rocketed away, they went on with normal stellar evolution. The more massive companion evolved more quickly, puffing up to become a red giant. It enveloped its partner, and the two stars spiraled together, merging into one superstar - a blue straggler.


This vagabond star has puzzled astronomers since its discovery in 2005 by the Hamburg/European Southern Observatory sky survey. Astronomers had proposed two possibilities to solve the age problem. The star either dipped into the Fountain of Youth by becoming a blue straggler, or it was flung out of the Large Magellanic Cloud, a neighboring galaxy.


Anderson then compared the star's position in images taken in 2006 with those taken in 2009 to calculate how far the star moved against the background galaxies. The star appeared to move, but only by 0.04 of a pixel (picture element) against the sky background. "Hubble excels with this type of measurement," Anderson says. "This observation would be challenging to do from the ground."

The results were published online in The Astrophysical Journal Letters on July 20, 2010. Brown is the paper's lead author.

The Hubble Space Telescope is a project of international cooperation between NASA and the European Space Agency. NASA's Goddard Space Flight Center manages the telescope. The Space Telescope Science Institute (STScI) conducts Hubble science operations. STScI is operated for NASA by the Association of Universities for Research in Astronomy, Inc. in Washington, D.C.


NASA Satellites' View of Gulf Oil Spill Over Time

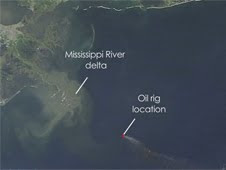
Two NASA satellites are capturing images of the oil spill in the Gulf of Mexico, which began April 20, 2010 with the explosion of the Deepwater Horizon oil rig. This short video reveals a space-based view of the burning oil rig and, later, the resulting spread of the oil spill. This version updates a previous version of the video through July 14th. The timelapse uses imagery from the MODIS instrument, on board NASA's Terra and Aqua satellites.


The oil slick appears grayish-beige in the image and changes due to changing weather, currents, and use of oil dispersing chemicals. The oil slick only appears clearly in MODIS imagery when the sun is a a particular angle in relation to the satellite's position as it orbits over the Gulf. In areas where sunlight reflects off the ocean's surface toward the satellite, oil-slicked water usually looks brighter than cleaner ocean water in the region. (no narration, music only)

Arctic Voyage Illuminating Ocean Optics

During NASA's ICESCAPE voyage to the Arctic, scientists have been looking at the phytoplankton in the Arctic's Chukchi Sea -- how many, how big and at what depths they are found. But there are other ways of looking at these small life forms.

"We measure phytoplankton in terms of their pigments and light absorption properties," said Stan Hooker of NASA's Ocean Biology and Biogeochemistry Calibration and Validation Office at Goddard Space Flight Center, Greenbelt, Md. Hooker, Joaquin Chaves and Aimee Neeley, also of NASA, measure the color of the water. Anything in the water, plankton or not, can influence that color.

On July 2, a crane maneuvered a small boat halfway down the side of the U.S. Coast Guard Cutter Healy – the platform for the five-week ICESCAPE mission, NASA's first dedicated oceanographic field campaign, which is studying the physics, chemistry and biology of the ocean and sea ice within a changing Arctic.

Hooker, Chaves and Coast Guard crew boarded the small boat and readied for an expedition away from the stirred water and shadow of the 420-foot Healy. Lowered to the ocean surface, Hooker's team powered away, entering uncharted waters.

Maneuvering over smooth water and around chunks of sea ice, the small boat slowed to a stop near the edge of an ice floe.

"This is new for us because we usually haven't been able to work this close to the ice before," Hooker said. "Satellites can't measure near the ice, so we do this to help specify the next generation of equipment, and to contribute to the science objectives."

First over the side was a small red instrument that the crew dropped on a line into the ocean and then reeled by hand, as if wrangling a fish. Sensors on the instrument measured the wavelengths of sunlight at different depths - both what's coming into the ocean and what's reflected back out which is similar to what is "seen" by satellites.

Next the crew lowered a second, larger package of instruments into the depths of the ocean. One pair of sensors emits light and measures how much is scattered back. Another pair measures the fluorescence of chlorophyll and colored dissolved organic matter, an important distinction as both appear green to satellites.

Last, the crew collected water samples to be returned to the Healy for analysis in the lab.

"We can measure the changes in the color to find out what's happening with the ecology," said Greg Mitchell, a research biologist at Scripps Institution of Oceanography in San Diego, who analyzes the water samples. "We can relate color back to how much chlorophyll is in the ocean, how much algae biomass there is, and processes such as the rate of photosynthesis."

Similar, more frequent measurements are made from the Healy, which marked its one-hundredth ocean station of the mission on July 8. The small boat deploys less often -- almost daily -- but reaches more targeted regions.

"We do the measurements at sea in order to relate what's going on in the ocean with the optics," Mitchell said. "Then we apply those relationships to the optical data from the ocean color satellites and we can make estimates of processes and distributions globally."

Onboard the Healy to help scientists figure out where to sample is Bob Pickart, a physical oceanographer from Woods Hole Oceanographic Institution. Pickart can decipher water type and circulation to guide where to make measurements.

A great unknown, for example, is a picture of what's feeding the evolution of a "hotspot" in Barrow Canyon. Right now, winter water -- rich with nutrients -- has been carried across the shallow shelf where the Healy is surveying.

"This is a really interesting, important time of year," Pickart said. "As the ice recedes, productivity is starting and things are getting cranked up."

But for how long will these hotspots thrive? While this is dictated by light and nutrients, the circulation near Barrow and Herald canyons -- two fissures that channel water off the shelf -- plays a vitally important role as well.

On July 12, after a night of cutting through sea ice, ICESCAPE scientists caught a glimpse of the hotspot. As an instrument lowered from the Healy descended through the water, real-time fluorescence information showed low levels of chlorophyll.

Scientists on the Healy will analyze the hotspot data and water samples, but whether a plankton bloom has come and gone, the region remains a hotspot for ground-dwelling communities, according to Karen Frey of Clark University. Feeding off plankton that sink to the seafloor, species here are diverse and large. A single sample retrieved from the ocean floor turned up a large crab, sponges and a sea star.

Meanwhile, samples returned from the near-ice survey July 2 on the small boat are turning up mixed results – sometimes indicating the presence of phytoplankton communities and sometimes not, according to Atsushi Matsuoka, of Laboratoire d'Oceanographie de Villefranche. To find out why, his group will look at trends after returning home from ICESCAPE.

Mars Descent Imager for Curiosity

Mars Descent Imager for Curiosit

This Mars Descent Imager (MARDI) camera will fly on the Curiosity rover of NASA's Mars Science Laboratory mission.

The downward-looking camera will take about four frames per second at nearly 1,600 by 1,200 pixels per frame for about the final two minutes before Curiosity touches down on Mars in August 2012. Malin Space Science Systems, San Diego, Calif., supplied MARDI and two other camera instruments for the mission. A pocketknife provides scale for the image.

Image credit: NASA/JPL-Caltech/Malin Space Science Systems

First-of-its-Kind Map Depicts Global Forest Heights

Using NASA satellite data, scientists have produced a first-of-its kind map that details the height of the world’s forests. Although there are other local- and regional-scale forest canopy maps, the new map is the first that spans the entire globe based on one uniform method.

The work -- based on data collected by NASA's ICESat, Terra, and Aqua satellites -- should help scientists build an inventory of how much carbon the world’s forests store and how fast that carbon cycles through ecosystems and back into the atmosphere. Michael Lefsky of the Colorado State University described his results in the journal Geophysical Research Letters.


The new map shows the world’s tallest forests clustered in the Pacific Northwest of North America and portions of Southeast Asia, while shorter forests are found in broad swaths across northern Canada and Eurasia. The map depicts average height over 5 square kilometers (1.9 square miles) regions), not the maximum heights that any one tree or small patch of trees might attain.

Temperate conifer forests -- which are extremely moist and contain massive trees such as Douglas fir, western hemlock, redwoods, and sequoias--have the tallest canopies, soaring easily above 40 meters (131 feet). In contrast, boreal forests dominated by spruce, fir, pine, and larch had canopies typically less than 20 meters (66 feet). Relatively undisturbed areas in tropical rain forests were about 25 meters (82 feet), roughly the same height as the oak, beeches, and birches of temperate broadleaf forests common in Europe and much of the United States.

Where’s the Carbon?

Scientific interest in the new map goes far beyond curiosities about tree height. The map has implications for an ongoing effort to estimate the amount of carbon tied up in Earth’s forests and for explaining what sops up 2 billion tons of “missing” carbon each year.

Humans release about 7 billion tons of carbon annually, mostly in the form of carbon dioxide. Of that, 3 billion tons end up in the atmosphere and 2 billion tons in the ocean. It’s unclear where the last two billion tons of carbon go, though scientists suspect forests capture and store much of it as biomass through photosynthesis.

There are hints that young forests absorb more carbon than older ones, as do wetter ones, and that large amounts of carbon end up in certain types of soil. But ecologists have only begun to pin down the details as they try to figure out whether the planet can continue to soak up so much of our annual carbon emissions and whether it will continue to do so as climate changes.

“What we really want is a map of above-ground biomass, and the height map helps get us there,” said Richard Houghton, an expert in terrestrial ecosystem science and the deputy director of the Woods Hole Research Center.

One of Lefsky’s colleagues, Sassan Saatchi of NASA’s Jet Propulsion Laboratory, has already started combining the height data with forest inventories to create biomass maps for tropical forests. Complete global inventories of biomass, when they exist, can improve climate models and guide policymakers on how to minimize the human impact on climate with carbon offsets.

More immediately, said University of Maryland remote sensing expert Ralph Dubayah, tree canopy heights can be plugged into models that predict the spread and behavior of fires, as well as ecological models that help biologists understand the suitability of species to specific forests.

Seeing Lasers through the Trees

Lefsky used data from a laser technology called LIDAR that’s capable of capturing vertical slices of surface features. It measures forest canopy height by shooting pulses of light at the surface and observing how much longer it takes for light to bounce back from the ground surface than from the top of the canopy. Since LIDAR can penetrate the top layer of forest canopy, it provides a fully-textured snapshot of the vertical structure of a forest -- something that no other scientific instrument can offer.

“LIDAR is unparalleled for this type of measurement,” Lefsky said, noting it would have taken weeks or more to collect the same amount of data in the field by counting and measuring tree trunks that LIDAR can capture in seconds.

He based his map on data from more than 250 million laser pulses collected during a seven year period. That may sound like an enormous amount of data, but each pulse returns information about just a tiny portion of the surface. Overall, the LIDAR offered direct measurements of 2.4 percent of the Earth’s forested surfaces.

To create his global map forest height map, Lefsky combined the LIDAR data with information from the Moderate Resolution Imaging Spectroradiometer (MODIS), a satellite instrument aboard both the Terra and Aqua satellites that senses a much broader swath of Earth’s surface, even though it doesn’t provide the vertical profile.

“This is a really just a first draft, and it will certainly be refined in the future,” said Lefsky.

Fusing the two sets of data proved difficult, and Lefsky spent years honing quantitative techniques to make the combination possible. Part of the difficulty was that the LIDAR data Lefsky used came from an instrument aboard ICESat, a mission optimized to study the topography of ice sheets, not vegetation.

The next generation LIDAR measurements of forests and biomass, which will improve the resolution of the map considerably, could come from NASA's Deformation, Ecosystem Structure and Dynamics of Ice (DESDynI) satellite, proposed for the latter part of this decade.

“We’ve never been able to look at a map and say here’s how tall the canopy is before,” said Dubayah, one of the DESDynI project scientists. “This map is a big step forward, and it really helps set the stage for DESDynI and shows what’s possible.” Related links


Image of the day

Making Home a Safer Place
One day homeowners everywhere may be protected from deadly carbon monoxide fumes, thanks to a device invented at NASA's Langley Research Center. The device uses a new class of low-temperature oxidation catalysts to convert carbon monoxide to non-toxic carbon dioxide at room temperature and also removes formaldehyde from the air. The catalysts initially were developed for research involving carbon dioxide lasers.

Apollo 11: One Giant Leap for Mankind


NASA's WISE Mission to Complete Extensive Sky Survey


PASADENA, Calif. -- NASA's Wide-field Infrared Survey Explorer, or WISE, will complete its first survey of the entire sky on July 17, 2010. The mission has generated more than one million images so far, of everything from asteroids to distant galaxies.

"Like a globe-trotting shutterbug, WISE has completed a world tour with 1.3 million slides covering the whole sky," said Edward Wright, the principal investigator of the mission at the University of California, Los Angeles.

Some of these images have been processed and stitched together into a new picture being released today. It shows the Pleiades cluster of stars, also known as the Seven Sisters, resting in a tangled bed of wispy dust. The pictured region covers seven square degrees, or an area equivalent to 35 full moons, highlighting the telescope's ability to take wide shots of vast regions of space.

The new picture was taken in February. It shows infrared light from WISE's four detectors in a range of wavelengths. This infrared view highlights the region's expansive dust cloud, through which the Seven Sisters and other stars in the cluster are passing. Infrared light also reveals the smaller and cooler stars of the family.

"The WISE all-sky survey is helping us sift through the immense and diverse population of celestial objects," said Hashima Hasan, WISE Program scientist at NASA Headquarters in Washington. "It's a great example of the high impact science that's possible from NASA's Explorer Program."

The first release of WISE data, covering about 80 percent of the sky, will be delivered to the astronomical community in May of next year. The mission scanned strips of the sky as it orbited around the Earth's poles since its launch last December. WISE always stays over the Earth's day-night line. As the Earth moves around the sun, new slices of sky come into the telescope's field of view. It has taken six months, or the amount of time for Earth to travel halfway around the sun, for the mission to complete one full scan of the entire sky.

For the next three months, the mission will map half of the sky again. This will enhance the telescope's data, revealing more hidden asteroids, stars and galaxies. The mapping will give astronomers a look at what's changed in the sky. The mission will end when the instrument's block of solid hydrogen coolant, needed to chill its infrared detectors, runs out.

"The eyes of WISE have not blinked since launch," said William Irace, the mission's project manager at NASA's Jet Propulsion Laboratory in Pasadena, Calif. "Both our telescope and spacecraft have performed flawlessly and have imaged every corner of our universe, just as we planned."

So far, WISE has observed more than 100,000 asteroids, both known and previously unseen. Most of these space rocks are in the main belt between Mars and Jupiter. However, some are near-Earth objects, asteroids and comets with orbits that pass relatively close to Earth. WISE has discovered more than 90 of these new near-Earth objects. The infrared telescope is also good at spotting comets that orbit far from Earth and has discovered more than a dozen of these so far.

WISE's infrared vision also gives it a unique ability to pick up the glow of cool stars, called brown dwarfs, in addition to distant galaxies bursting with light and energy. These galaxies are called ultra-luminous infrared galaxies. WISE can see the brightest of them.

"WISE is filling in the blanks on the infrared properties of everything in the universe from nearby asteroids to distant quasars," said Peter Eisenhardt of JPL, project scientist for WISE. "But the most exciting discoveries may well be objects we haven't yet imagined exist."

JPL manages the Wide-field Infrared Survey Explorer for NASA's Science Mission Directorate in Washington. The mission was selected under NASA's Explorers Program managed by the Goddard Space Flight Center in Greenbelt, Md. The science instrument was built by the Space Dynamics Laboratory in Logan, Utah, and the spacecraft was built by Ball Aerospace & Technologies Corp., in Boulder, Colo. Science operations and data processing take place at the Infrared Processing and Analysis Center at the California Institute of Technology in Pasadena. Caltech manages JPL for NASA.

Image of the day

Aerojet AJ26 Rocket Engine Arrives at Stennis
An Aerojet AJ26 rocket engine was delivered to NASA's John C. Stennis Space Center on July 15, 2010. This is the first of a series of Taurus II engines to be tested at Stennis to include acceptance testing of flight engines. Stennis will provide propulsion system acceptance testing for the Taurus II space launch vehicle, which is being developed by Orbital Sciences Corporation of Dulles, Va. The first Taurus II mission will be flown in support of NASA's Commercial Orbital Transportation Services cargo demonstration to the International Space Station. Orbital's Taurus II design uses a pair of Aerojet AJ26 rocket engines to provide first stage propulsion for the new launch vehicle.

Meet the Titans: Dust Disk Found Around Massive Star

A new discovery has the potential to answer the long-standing question of how massive stars are born -- and hints at the possibility that planets could form around the galaxy's biggest bodies.
"Astronomers have long been unclear about how the most massive stars form," said Stefan Kraus, a NASA Sagan Exoplanet Fellow and astronomer at the University of Michigan, Ann Arbor. "Because they tend to be at very large distances and surrounded by dusty envelopes, it's very hard to separate and closely observe them."

To get a better look, Kraus' team used the Very Large Telescope Interferometer of the European Southern Observatory in Chile to focus on IRAS 13481-6124, a star located at a distance of 10,000 light-years away in the constellation Centaurus, and about 20 times more massive than our sun. "We were able to get a very sharp view into the innermost regions around this star by combining the light of separate telescopes," Kraus said, "basically mimicking the resolving power of a telescope with an incredible 85-meter [280-foot] mirror."

The team's observations yielded a jackpot result: the discovery of a massive disk of dust and gas encircling the giant young star. "It's the first time something like this has been observed," Kraus said. "The disk very much resembles what we see around young stars that are much smaller, except everything is scaled up and more massive."

The presence of the disk is strong evidence that even the very largest stars in the galaxy form by the same process as smaller ones -- growing out of the dense accumulation of vast quantities of gas and dust, rather than the merging of smaller stars, as had been previously suggested by some scientists. The results were confirmed by NASA's Spitzer Space Telescope. "We looked at archival images of the star taken by Spitzer, and confirmed that the star is flinging disk material outward from its polar regions, just as we see with smaller stars and their dust disks," Kraus said.

The discovery also opens up the possibility that planets, perhaps even Earth-like ones, may be able to form around massive stars like IRAS 13481-6124, in the same way that they formed around our sun when it was much younger. "In the future, we might be able to see gaps in this and other dust disks created by orbiting planets, although it is unlikely that such bodies could survive for long." Kraus said. "A planet around such a massive star would be destroyed by the strong stellar winds and intense radiation as soon as the protective disk material is gone, which leaves little chance for the development of solar systems like our own."

Still, huge stars like IRAS 13481-6124 provide the building blocks for life to arise elsewhere in the universe. "High-mass stars are where heavy elements necessary for life are created, so they are of major importance," Kraus said "This discovery is a clearer picture than we've had before and allows us to understand them better."

Spitzer previously detected dusty disks of planetary debris around more mature massive stars, further supporting the notion that planets may form even in these extreme environments. More information about that research is online at: http://www.spitzer.caltech.edu/news/230. More information about NASA's planet-finding missions is online at http://planetquest.jpl.nasa.gov.
The recent and previous Spitzer observations were made before the space telescope ran out of its liquid coolant in May 2009, officially beginning its warm mission.

NASA's Jet Propulsion Laboratory, Pasadena, Calif., manages the Spitzer Space Telescope mission for NASA's Science Mission Directorate, Washington. Science operations are conducted at the Spitzer Science Center at the California Institute of Technology, also in Pasadena. Caltech manages JPL for NASA.

The Sagan Fellowship Program, administered by the NASA Exoplanet Science Institute (NExScI) at Caltech aims to advance the scientific and technical goals of NASA's Exoplanet Exploration Program.

Hot New Rover Wheels!

Image of the day

The View From Easter Island
On July 11, 2010, the new moon passed directly in front of the sun, causing a total solar eclipse in the South Pacific. In this image, the solar eclipse is shown in gray and white from a photo provided by the Williams College Expedition to Easter Island and was embedded with an image of the sun’s outer corona taken by the Large Angle Spectrometric Coronagraph (LASCO) on the SOHO spacecraft and shown in red false color. LASCO uses a disk to blot out the bright sun and the inner corona so that the faint outer corona can be monitored and studied. Further, the dark silhouette of the moon was covered with an image of the sun taken in extreme ultraviolet light at about the same time by the Atmospheric Imaging Assembly on the Solar Dynamics Observatory. The composite brings out the correlation of structures in the inner and outer corona.

NASA's Virtual 'Summer Science Camp' Continues With Today's Chat About Black Holes

Ask an Expert: Why Black Holes Suck
There are many cultural myths concerning black holes -- several of the myths are perpetuated by television and movies. Black holes have been portrayed as time-traveling tunnels to another dimension, or as cosmic vacuum cleaners sucking up everything in sight. Black holes are really just the evolutionary end points of massive stars. Somehow, this simple explanation makes them no easier to understand.

On Thursday, July 15, NASA scientist Jerry Fishman from NASA's Marshall Space Flight Center will answer your questions about black holes and dispel the myths surrounding these mysterious objects from which nothing escapes.

More About Chat Expert Gerald (Jerry) Fishman
Gerald (Jerry) Fishman is a research astrophysicist with NASA's Marshall Space Flight Center and the Chief Scientist for Gamma-ray Astronomy there.

He was the Principal Investigator of the Burst and Transient Source Experiment (BATSE) on the Compton Gamma Ray Observatory. This observatory was the second of NASA's Four Great Observatories in Space (after Hubble). It was launched by the Space Shuttle Atlantis in April 1991 and operated until May 2000. The BATSE experiment produced new scientific results on some of the most energetic and violent objects in the Universe, in particular, gamma-ray bursts, the most explosive and most distant objects known. He has lectured extensively on these findings at major universities and planetariums in the US and at numerous scientific conferences abroad. This experiment also serendipitously discovered terrestrial gamma-ray flashes above thunderstorms.

Dr. Fishman has over two hundred publications in his research areas. He received the NASA Outstanding Scientific Achievement Award in 1982, 1991 and 1993. He was awarded the Bruno Rossi Prize of the High Energy Astrophysics Division of the American Astronomical Society in 1994, that Division's highest award. In 1996 he became a Fellow of the American Physical Society.

NASA Finds Super-Hot Planet with Unique Comet-Like Tail

Astronomers using NASA's Hubble Space Telescope have confirmed the existence of a baked object that could be called a "cometary planet." The gas giant planet, named HD 209458b, is orbiting so close to its star that its heated atmosphere is escaping into space.

Observations taken with Hubble's Cosmic Origins Spectrograph (COS) suggest powerful stellar winds are sweeping the cast-off atmospheric material behind the scorched planet and shaping it into a comet-like tail.

"Since 2003 scientists have theorized the lost mass is being pushed back into a tail, and they have even calculated what it looks like," said astronomer Jeffrey Linsky of the University of Colorado in Boulder, leader of the COS study. "We think we have the best observational evidence to support that theory. We have measured gas coming off the planet at specific speeds, some coming toward Earth. The most likely interpretation is that we have measured the velocity of material in a tail."

The planet, located 153 light-years from Earth, weighs slightly less than Jupiter but orbits 100 times closer to its star than the Jovian giant. The roasted planet zips around its star in a short 3.5 days. In contrast, our solar system's fastest planet, Mercury, orbits the Sun in 88 days. The extrasolar planet is one of the most intensely scrutinized, because it is the first of the few known alien worlds that can be seen passing in front of, or transiting, its star. Linsky and his team used COS to analyze the planet's atmosphere during transiting events. During a transit, astronomers study the structure and chemical makeup of a planet's atmosphere by sampling the starlight that passes through it. The dip in starlight because of the planet's passage, excluding the atmosphere, is very small, only about 1.5 percent. When the atmosphere is added, the dip jumps to 8 percent, indicating a bloated atmosphere.

COS detected the heavy elements carbon and silicon in the planet's super-hot, 2,000-degree-Fahrenheit atmosphere. This detection revealed the parent star is heating the entire atmosphere, dredging up the heavier elements and allowing them to escape the planet.

The COS data also showed the material leaving the planet was not all traveling at the same speed. "We found gas escaping at high velocities, with a large amount of this gas flowing toward us at 22,000 miles per hour," Linsky said. "This large gas flow is likely gas swept up by the stellar wind to form the comet-like tail trailing the planet."

Hubble's newest spectrograph has the ability to probe a planet's chemistry at ultraviolet wavelengths not accessible to ground-based telescopes. COS is proving to be an important instrument for probing the atmospheres of "hot Jupiters" like HD 209458b.

Another Hubble instrument, the Space Telescope Imaging Spectrograph (STIS), observed the planet in 2003. The STIS data showed an active, evaporating atmosphere, and a comet-tail-like structure was suggested as a possibility. But STIS wasn't able to obtain the spectroscopic detail necessary to show a tail, or an Earthward-moving component of the gas, during transits. The tail was detected for the first time because of the unique combination of very high ultraviolet sensitivity and good spectral resolution provided by COS.

Although this extreme planet is being roasted by its star, it won't be destroyed anytime soon. "It will take about a trillion years for the planet to evaporate," Linsky said.

The results appeared in the July 10 issue of The Astrophysical Journal.

The Hubble Space Telescope is a project of international cooperation between NASA and the European Space Agency. NASA’s Goddard Space Flight Center manages the telescope. The Space Telescope Science Institute (STScI) conducts Hubble science operations. STScI is operated for NASA by the Association of Universities for Research in Astronomy, Inc. in Washington, D.C.

Image of the day

In the Constellation Cassiopeia
Tycho's Supernova, the red circle visible in the upper left part of the image, is SN 1572 is a remnant of a star explosion is named after the astronomer Tycho Brahe, although he was not the only person to observe and record the supernova. When the supernova first appeared in November 1572, it was as bright as Venus and could be seen in the daytime. Over the next two years, the supernova dimmed until it could no longer be seen with the naked eye. In the 1950s, the remnants of the supernova could be seen again with the help of telescopes.

When the star exploded, it sent out a blast wave into the surrounding material, scooping up interstellar dust and gas as it went, like a snow plow. An expanding shock wave traveled into the surroundings and a reverse shock was driven back in toward the remnants of the star. Previous observations by NASA's Spitzer Space Telescope indicate that the nature of the light that WISE sees from the supernova remnant is emission from dust heated by the shock wave.

To the right is a star-forming nebula of dust and gas, called S175. This cloud of material is about 3,500 light-years away and 35 light-years across. It is heated by radiation from the young, hot stars within it, and the dust within the cloud radiates infrared light.


Researchers Witness Overnight Breakup, Retreat of Greenland Glacier


NASA-funded researchers monitoring Greenland's Jakobshavn Isbrae glacier report that a 7 square kilometer (2.7 square mile) section of the glacier broke up on July 6 and 7, as shown in the image above. The calving front – where the ice sheet meets the ocean – retreated nearly 1.5 kilometers (a mile) in one day and is now further inland than at any time previously observed. The chunk of lost ice is roughly one-eighth the size of Manhattan Island, New York.

Research teams led by Ian Howat of the Byrd Polar Research Center at Ohio State University and Paul Morin, director of the Antarctic Geospatial Information Center at the University of Minnesota have been monitoring satellite images for changes in the Greenland ice sheet and its outlet glaciers. While this week's breakup itself is not unusual, Howat noted, detecting it within hours and at such fine detail is a new phenomenon for scientists.

"While there have been ice breakouts of this magnitude from Jakonbshavn and other glaciers in the past, this event is unusual because it occurs on the heels of a warm winter that saw no sea ice form in the surrounding bay," said Thomas Wagner, cryospheric program scientist at NASA Headquarters. "While the exact relationship between these events is being determined, it lends credence to the theory that warming of the oceans is responsible for the ice loss observed throughout Greenland and Antarctica."

The researchers relied on imagery from several satellites, including Landsat, Terra, and Aqua, to get a broad view of ice changes at both poles. Then, in the days leading up to the breakup, the team received images from DigitalGlobe's WorldView 2 satellite showing large cracks and crevasses forming.

DigitalGlobe Inc. provides the images as part of a public-private partnership with U.S. scientists. Howat and Morin are receiving near-daily satellite updates from the Jakobshavn, Kangerlugssuaq, and Helheim glaciers (among the islands largest) and weekly updates on smaller outlet glaciers.

Jakobshavn Isbrae is located on the west coast of Greenland at latitude 69°N and has been retreated more than 45 kilometers (27 miles) over the past 160 years, 10 kilometers (6 miles) in just the past decade. As the glacier has retreated, it has broken into a northern and southern branch. The breakup this week occurred in the north branch.

Scientists estimate that as much as 10 percent of all ice lost from Greenland is coming through Jakobshavn, which is also believed to be the single largest contributor to sea level rise in the northern hemisphere. Scientists are more concerned about losses from the south branch of the Jakobshavn, as the topography is flatter and lower than in the northern branch.

In addition to the remote sensing work, Howat, Morin, and other researchers have been funded by NASA and the National Science Foundation to plant GPS sensors, cameras, and other scientific equipment on top of the ice sheet to monitor changes and understand the fundamental workings of the ice. NASA also has been conducting twice-yearly airborne campaigns to the Arctic and Antarctic through the IceBridge program and measuring ice loss with the ICESat and GRACE satellites.

Apollo-Soyuz: An Orbital Partnership Begins

Apollo-Soyuz: An Orbital Partnership Begins
Most of us take it for granted today that American astronauts and Russian cosmonauts live and work together in Earth orbit. They've been doing it for years, first in the Shuttle-Mir program, and now on the International Space Station.

But before the two Cold War-rivals first met in orbit in 1975, such a partnership seemed unlikely. Since Sputnik bleeped into orbit in 1957, the superpowers were driven by the Space Race, with the U.S. and then-Soviet Union driven more by competition than cooperation. When President Kennedy called for a manned moon landing in 1961, he spoke of "battle that is now going on around the world between freedom and tyranny" and referred to the "head start obtained by the Soviets with their large rocket engines."

But by the mid-70s things had changed. The U.S. had "won" the race to the Moon, with six Apollo landings between 1969 and 1972. Both nations had launched space stations, the Russian Salyut and American Skylab. With the Space Shuttle still a few years off and the diplomatic chill thawing, the time was right for a joint mission.

The Apollo-Soyuz Test Project would send NASA astronauts Tom Stafford, Deke Slayton and Vance Brand in an Apollo Command and Service Module to meet Russian cosmonauts Aleksey Leonov and Valeriy Kubasov in a Soyuz capsule. A jointly designed, U.S.-built docking module fulfilled the main technical goal of the mission, demonstrating that two dissimilar craft could dock in orbit. But the human side of the mission went far beyond that.

The training leading up to the mission exposed the two crews to each other's nations, helping to break down cultural and language barriers. As Brand said in a 2000 interview, amid the Cold War tensions, "we thought they were pretty aggressive people and ... they probably thought we were monsters. So we very quickly broke through that, because when you deal with people that are in the same line of work as you are, and you’re around them for a short time, why, you discover that, well, they're human beings."

In a 1997 interview, Stafford described how they got around the language problem. "Each crew would speak his own language, and the other would have to understand," he said. It just wasn't working, until Stafford and the Russian backup commander had the idea to speak in the other's language. "So we started," he said, "and boy, it worked slick as a whistle."


NASA - Images from Space of the Oil Spill

Study Finds Amazon Storm Killed Half a Billion Trees

A single, huge, violent storm that swept across the whole Amazon forest in 2005 killed half a billion trees, according to a new study funded by NASA and Tulane University, New Orleans.

While storms have long been recognized as a cause of Amazon tree loss, this study is the first to actually quantify losses from a storm. And the losses are much greater than previously suspected, say the study's authors, which include research scientist Sassan Saatchi of NASA’s Jet Propulsion Laboratory, Pasadena, Calif. The work suggests that storms may play a larger role in the dynamics of Amazon forests than previously recognized, they add.

Previous research had attributed a peak in tree mortality in 2005 solely to a severe drought that affected parts of the forest. The new study says that a single squall line (a long line of severe thunderstorms, the kind associated with lightning and heavy rainfall) had an important role in the tree demise. Research suggests this type of storm might become more frequent in the future in the Amazon due to climate change, killing a higher number of trees and releasing more carbon to the atmosphere.

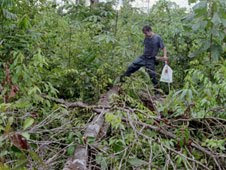
From Jan. 16 to 18, 2005, a squall line 1,000 kilometers (620 miles) long and 200 kilometers (124 miles) wide crossed the whole Amazon basin from southwest to northeast, causing several human deaths in the cities of Manaus, Manacaparu, and Santarem. The strong vertical winds associated with the storm, blowing up to 145 kilometers per hour (90 miles per hour), uprooted or snapped in half trees that were in their path. In many cases, the stricken trees took down some of their neighbors when they fell.

The researchers used a combination of Landsat satellite images, field-measured tree mortality, and modeling to determine the number of trees killed by the storm. By linking satellite data to observations on the ground, the researchers were able to take into account smaller tree blowdowns (less than 10 trees) that otherwise cannot be detected through satellite images.

Looking at satellite images for the area of Manaus from before and after the storm, the researchers detected changes in the reflectivity of the forest, which they suspected were indicative of tree losses. Undisturbed forest patches appeared as closed, green canopy in satellite images. When trees die and fall, a clearing opens, exposing wood, dead vegetation, and surface litter. This so-called "woody signal" only lasts for about a year in the Amazon. In a year, vegetation re-grows and covers the exposed wood and soil. This means the signal is a good indicator of recent tree deaths.
"If a tree dies from a drought, it generally dies standing. It looks very different from trees that die snapped by a storm," Chambers says.

In the most affected plots, near the centers of large blowdowns, up to 80 percent of the trees had been killed by the storm.

By comparing their field data and the satellite observations, the researchers determined that the satellite images were accurately pinpointing areas of tree death, and they calculated that the storm had killed between 300,000 and 500,000 trees in the area of Manaus. The number of trees killed by the 2005 storm is equivalent to 30 percent of the annual deforestation in that same year for the Manaus region, which experiences relatively low rates of deforestation.

The team then extrapolated the results to the whole Amazon basin.

"We know that the storm was intense and went across the basin," Chambers says. "To quantify the potential basin-wide impact, we assumed that the whole area impacted by the storm had a similar level of tree mortality as the mortality observed in Manaus."

The researchers estimate that between 441 and 663 million trees were destroyed across the whole basin. This represents a loss equivalent to 23 percent of the estimated mean annual carbon accumulation of the Amazon forest.

Squall lines that move from southwest to northeast of the forest, like the one in January 2005, are relatively rare and poorly studied, says Robinson Negron-Juarez, an atmospheric scientist at Tulane University, and lead author of the study. Storms that are similarly destructive but advance in the opposite direction (from the northeast coast of South America to the interior of the continent) occur up to four times per month. They can also generate large forest blowdowns (contiguous patches of wind-toppled trees), although it's infrequent that either of these two types of storms crosses the whole Amazon.

"We need to start measuring the forest perturbation caused by both types of squall lines, not only by the ones coming from the south," Negron-Juarez says. "We need that data to estimate total biomass loss from these natural events, which has never been quantified."

Chambers says that authors of previous studies on tree mortality in the Amazon have diligently collected dead-tree tolls, but information on exactly what killed the trees is often lacking, or not reported.

"It's very important that when we collect data in the field, we do forensics on tree mortality," says Chambers, who has been studying forest ecology and carbon cycling in the Amazon since 1993. "Under a changing climate, some forecasts say that storms will increase in intensity. If we start seeing increases in tree mortality, we need to be able to say what's killing the trees."

Microsoft and NASA Bring Mars Down to Earth Through the WorldWide Telescope

Microsoft and NASA Bring Mars Down to Earth Through the WorldWide Telescope
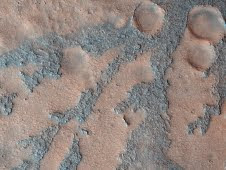
Today, Microsoft Research and NASA are providing an entirely new experience to users of the WorldWide Telescope, which will allow visitors to interact with and explore our solar system like never before. Viewers can now take exclusive interactive tours of the red planet, hear directly from NASA scientists, and view and explore the most complete, highest-resolution coverage of Mars available.

Dan Fay, director of Microsoft Research’s Earth, Energy and Environment effort, works with scientists around the world to see how technology can help solve their research challenges. Since early 2009, hes been working with NASA to bring imagery from the agency’s Mars and Moon missions to life, and to make their valuable volumes of information more accessible to the masses.

“We wanted to make it easier for people everywhere, as well as scientists, to access these unique and valuable images,” says Fay. “NASA had the images and they were open to new ways to share them. Through the WorldWide Telescope we were able to build a user interface at WWT|Mars that would allow people to take advantage of the great content they had.”

To create the new Mars experience in the WorldWide Telescope, Fay worked closely with Michael Broxton of the NASA Ames Research Center’s Intelligent Robotics Group (IRG). Broxton leads a team in the IRG informally called the Mapmakers, which applies computer vision and image processing to problems of cartography. Over the years, the Mapmakers have taken satellite images from Mars, the moon and elsewhere, and turned them into useful maps. Broxton says that getting the results of NASA’s work out to the public is an important part of his mission.

NASA has a history of providing the public with access to our spacecraft imagery,” he says. “With projects like the WorldWide Telescope, we’re working to provide greater access so that future generations of scientists can discover space in their own way.”

It is the mission of Fay’s team at Microsoft to push the boundaries of technology in service of scientific discovery and advance the state of the art in computer science overall. He explains that the approach to the Mars WorldWide Telescope project was to provide information at your fingertips. As such, Fay says the WorldWide Telescope is as much a research project as a Web service — one that has resulted in a truly stellar experience for users.

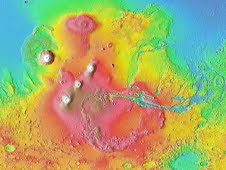
“We were able to take the imagery from NASA, combine it with their elevation models and lay those onto the surface of the globe of Mars,” Fay says. “Now users of the WorldWide Telescope can zoom down and actually experience the surface-level detail of Mars. They can pan back and see the height of the craters or the depth of the canyons. The new Mars experience allows people to feel as though they’re actually there.”

In particular, there’s a new dataset from the University of Arizona’s High Resolution Imaging Science Experiment (HiRISE), a state-of-the-art, remote-sensing camera on NASA’s Mars Reconnaissance Orbiter. HiRISE collects incredible images of super high resolution — a quarter of a meter per pixel on average. Each HiRISE image is a gigapixel in size, containing 100 times as much information as a 10 megapixel off-the-shelf camera.

“Due to its size, the data set is too unwieldy for many people to work with,” notes Fay. “But that large data set is necessary to provide the most in-depth experience — the most beautiful images, which are full of information. We needed this immense level of data to even begin to attempt to create this unique Mars experience.”

To get those images out to the public in a new way, the team set an ambitious goal to take all of the HiRISE images, 13,000 or so, and stitch them onto a single coherent map. While HiRISE has only imaged about 1 percent of Mars, leaving vast regions of Mars still to be explored, all of the HiRISE images have now been geolocated on a single map, and correlated with other global Mars data sets. Dotted with HiRISE images acquired so far, this new coherent map is the highest-resolution map of Mars’ surface ever constructed.

“Not only is it going to be amazing for the general public to see, but it’s actually something that scientists have never been able to see before,” Broxton says. “This particular feat has never been attempted.”
Retrieving images from all over the world is as smooth as any experience on the Web today. The secret is a tiling system that uses the visitor’s desktop computer to process the imagery. With such a huge amount of information contained in one coherent tool, users are able to browse and zoom into interesting locations as they please. Visitors to the WorldWide Telescope can now have the experience of flying though a 3-D rendering of Victoria Crater and Olympus Mons — a low valley and the highest peak in our solar system — and can experience firsthand the extreme elevation and intricate features on the Martian surface.

“We take advantage of the computing power you have on your desktop to allow a smooth, 3-D experience,” explains Fay. “As you zoom in, it’s a really constant view of these images. You can now get a true sense for what the terrain looks like.”

Broxton says the 3-D effect is derived from information provided by an instrument called MOLA, the Mars Orbiter Laser Altimeter, which measured altitude along the surface of Mars from space from NASA’s Mars Global Surveyor orbiter. The team also combined that information with a stereo image-reconstruction process — taking two images from different angles and using that to build a 3-D model of the terrain.

“These images give you a particularly visceral impression of, for example, the Mars Exploration Rover landing sites,” Broxton says. “You can see what it’s like in the hills there or zoom into surface craters. It’s really amazing stuff.”

For scientists and hardcore hobbyists, Fay’s team at Microsoft has developed another feature that puts the image in the context of the mission from which it was collected. Users can right-click on some of the images and find their original Web pages at NASA with additional details on the HiRISE project.

“So it’s not just the imagery, but bringing it together with the context,” Fay says. “We think that capability will make this an exciting tool for scientists and educators.”

So what is the surface of Mars like? According to Broxton, part of what’s striking about Mars is its similarity to what we’re used to here on Earth. Mars shares many of the same Aeolian (wind), tectonic, volcanic and even water processes, the effects of which are visible on the planet’s surface.